After my recent post I did not stop tinkering and exploring. To my own surprise it didn’t take long to come across significant improvements to my toolchain.
Someone contacted me on mastodon shortly after and said that a friend of his had also recently gotten into SDRs and ADS-B and decided to write his on demodulator called stream1090. While this is actively in development and still early stages, this part from the README resonated with me.
“Most implementations look for the so-called preamble (a sequence of pulses anounncing a message). Stream1090 skips this step and maintains directly a set of shift registers. Based on the CRC sum and other criteria, messages are being identified. The hope is that in high traffic situations, a higher overall message rate can be achieved compared to a preamble based approach.”
Being only a demodulator means that the emitted data needs further processing. Additionally, this tool does not directly talk to your SDR, which makes the resulting pipeline seem a bit more complex at first — but it’s not as bad as it looks.
In my last post the toolchain consisted of two tools
- readsb (read from SDR, demodulate, decode, write stats)
- tar1090 (read stats, render map)
With the new toolchain I’m streaming demodulated data into readsb. For this to work, the readsb command has two additional flags for specifying the port on which to stream data into and another port for some graphs (more on that later).
The full command looks like this now:
./readsb --net-only \
  --net-ri-port 30001 \
    --net-bo-port 30005 \
    --interactive \
    --lat 52.5200 \
    --lon 13.4050 \
    --write-json ~/src/adsb/json \
    --write-json-every 1 \
    --db-file "$HOME/src/readsb/aircraft.csv.gz"
stream1090
Now it’s time to stream some data into readsb. As with most of these tools, none of them consider macOS as a target platform but luckily for me, I could compile all of them successfully albeit with some tinkering. In this case compilation was pretty effortless and I just followed the instructions from the README.
After that I started readsb with the command above and then used this command to get the data from the SDR, pipe it into stream1090 and then into readsb via socat.
rtl_sdr -g 49.6 -f 1090000000 -s 2400000 - | ./build/stream1090 | socat -u - TCP4:localhost:30001
Improved rendering and graph setup
The rendering setup thus far isn’t bad. Essentially I just started a python web server for tar1090 to render a nice map. However, I wanted more longterm statistics of my experiments and searched for some kind of graphing solution.
Maybe you’ve already guessed it but of course there is a tool for it and the name is of course graph1090 (https://github.com/wiedehopf/graphs1090).
Compared to the other tools so far, this one is not as nice to install as it as a bunch of dependencies that I don’t want to install on my main workstation. Among them are classics like rrdtool, gnuplot and coreutils – with the first two having many more dependencies.
Docker / Apple Container / OCI solution
I was wondering if there might be a Docker image that I could use instead and if there wasn’t I’d rather make one myself to contain this zoo of dependencies.
Again luckily for me, there are (at least) two suitable docker images.
- https://github.com/sdr-enthusiasts/docker-tar1090
- https://github.com/sdr-enthusiasts/docker-adsb-ultrafeeder
Both of these bundle a lot of ADS-B processing tools at the price of shoehorning all those config parameters of the various tools into the Docker domain.
I’ve started with the first image which I got running using Apple Containers
container run -d --name tar1090 \
  --publish 8080:80 \
  --env TZ=Europe/Berlin \
  --env BEASTHOST=10.0.0.80 \
  --env BEASTPORT=30005 \
  --env LAT=52.5200 \
  --env LONG=13.4050 \
  --volume ~/src/adsb/graphs:/var/lib/collectd \
  ghcr.io/sdr-enthusiasts/docker-tar1090:latest
With the the two previous commands already running I could then point my browser to localhost:8080 to see my familiar tar1090 map.
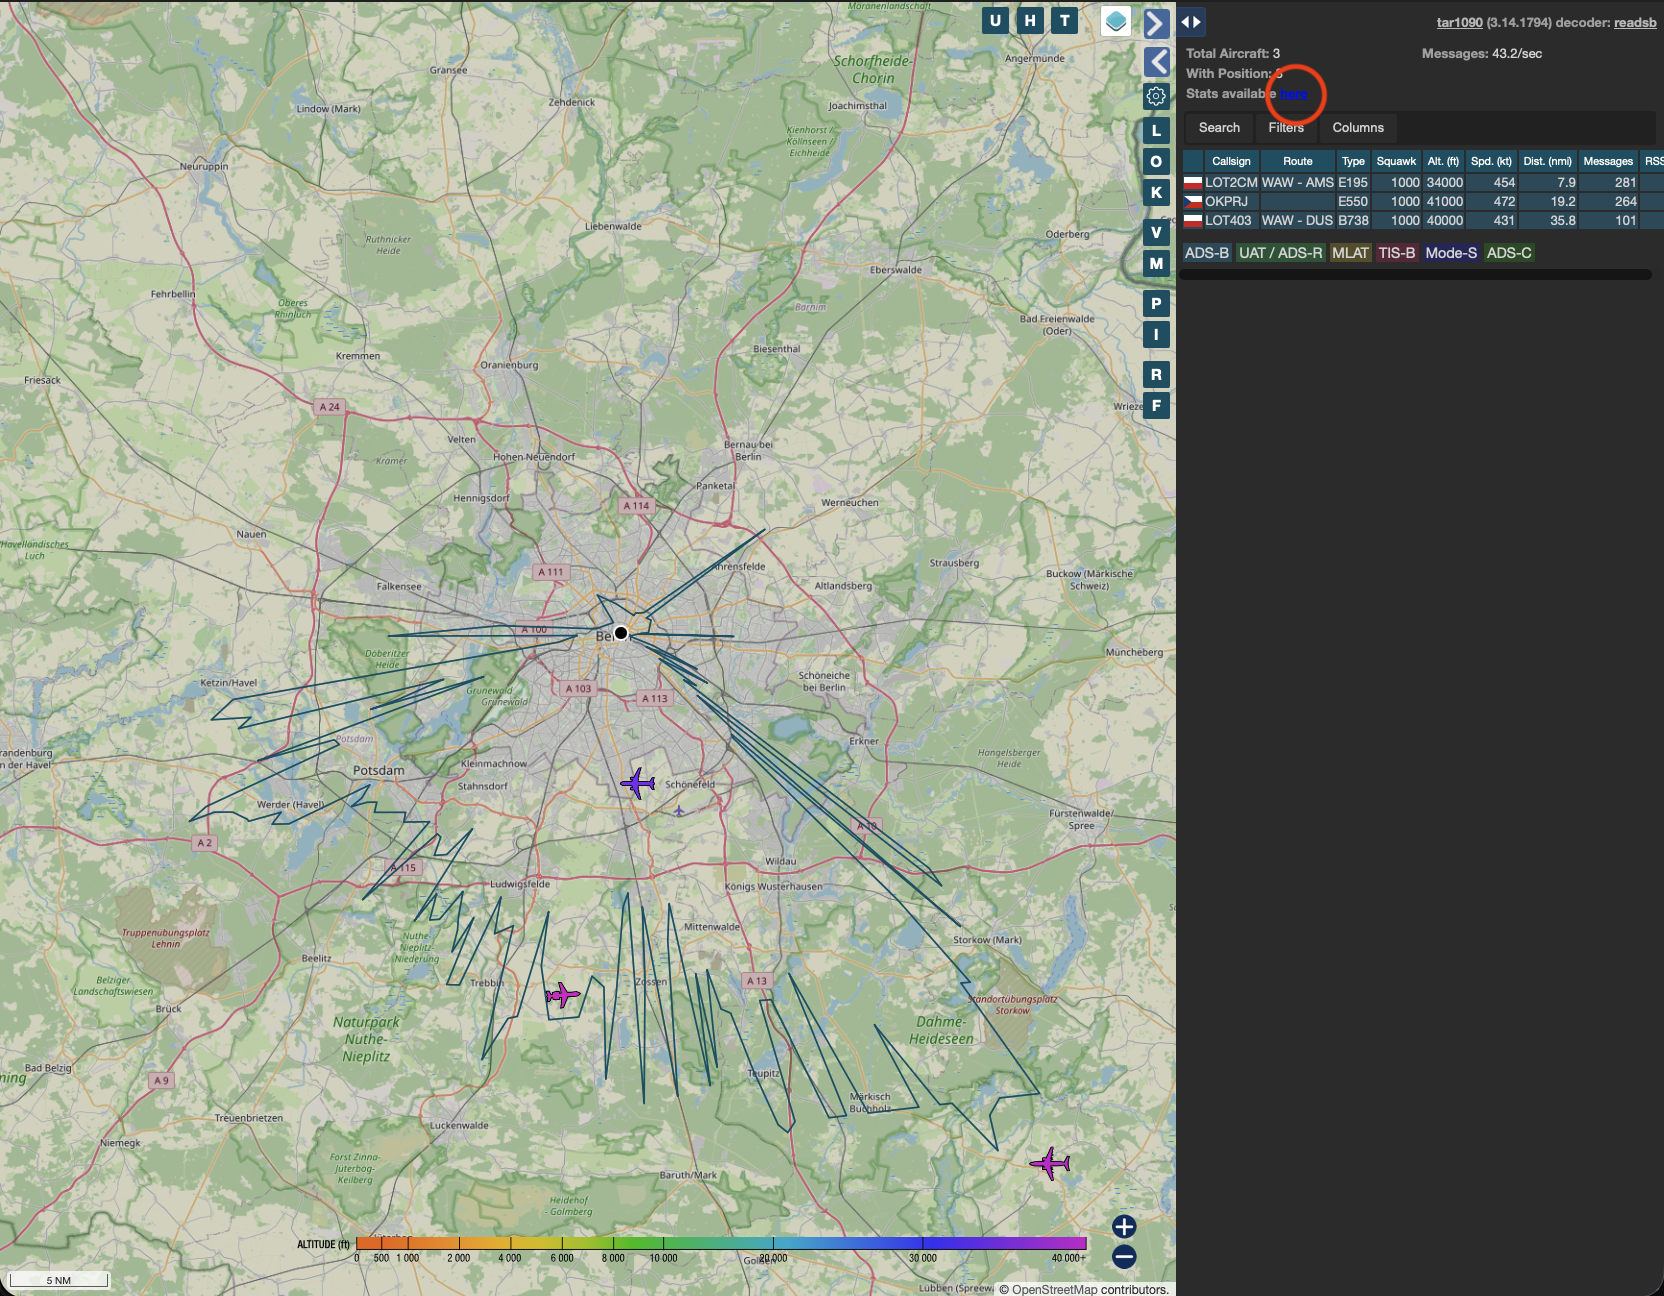
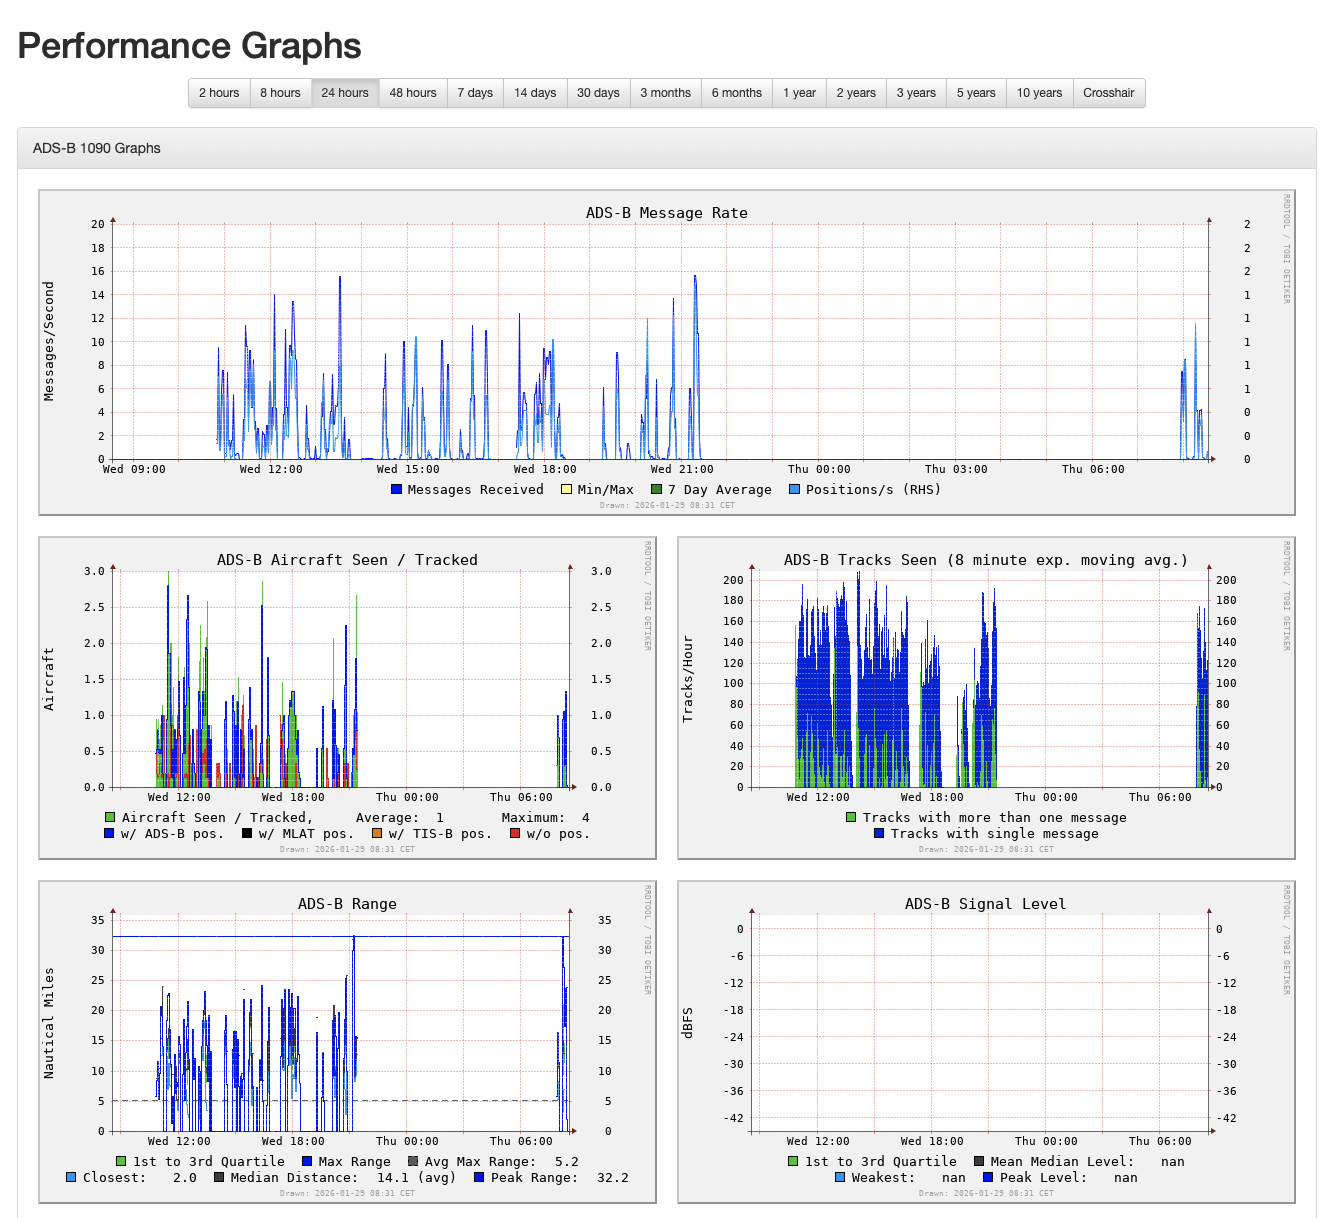
Additionally I got a barely visible link to some stats which you can make permanent between machine / container restarts with the --volume flag.
While the second image (ultrafeeder) looks even more complete and feature rich, I’ll stick with the first image for the time being.
Further enhancements
As you can see, my reception range has increased quite a bit. I noticed a slight improvement when switching to stream1090 and then I moved my little dipole telescope kit antenna as close to the window as possible.
Later this week I will receive a combined Low Noise Amplifier (LNA) and Filter specifically for ADS-B. I will add another post if that yields signficant reception improvements.